The goal of tfboot is to facilitate statistical analysis of SNPs disrupting transcription factor binding sites (TFBS) using bootstrapping resampling to create empirical null distributions.
If you use tfboot, please consider citing the paper: Turner, S.D., et al. (2023). tfboot: Bootstrapping and statistical analysis for transcription factor binding site-disrupting variants in gene sets. bioRxiv 2023.07.14.549004. DOI: 10.1101/2023.07.14.549004.
Installation
You can install tfboot from GitHub with the code below. To install only tfboot:
# install.packages("devtools")
devtools::install_github("colossal-compsci/tfboot")
To install required and suggested packages, including motifbreakR and those needed to build the vignette:
# install.packages("devtools")
devtools::install_github("colossal-compsci/tfboot",
                         build_vignettes = TRUE,
                         dependencies = c("Imports", "Suggests"))
See the pkgdown documentation for an introductory vignette and function documentation.
Example
Let’s use an example from the vignette. First, let’s load some pre-baked motifbreakR results. mbres is a set of motifbreakR results run on SNPs in the 5kb promoter region of a random selection of 5 genes. mball is the precomputed set of motifbreakR results run on SNPs in the promoter region of all genes.
mbres <- vignettedata$mbres
mbres
#> # A tibble: 1,335 × 10
#>    gene_id   SNP_id            tf    pctRef pctAlt scoreRef scoreAlt effect alleleDiff alleleEffectSize
#>    <chr>     <chr>             <chr>  <dbl>  <dbl>    <dbl>    <dbl> <chr>       <dbl>            <dbl>
#>  1 100316005 chr33:7472152_G/C ACE2   0.986  0.783     4.85     3.87 strong     -0.980          -0.199
#>  2 100316005 chr33:7472176_T/G ADR1   0.759  0.917     3.34     4.01 weak        0.673           0.154
#>  3 100316005 chr33:7471139_A/C AFT2   0.964  0.878     5.50     5.02 weak       -0.480          -0.0843
#>  4 100316005 chr33:7472176_T/G AFT2   0.902  0.740     5.15     4.24 strong     -0.911          -0.160
#>  5 100316005 chr33:7473834_G/T AFT2   0.879  0.705     5.02     4.04 strong     -0.980          -0.172
#>  6 100316005 chr33:7472152_G/C AGL42  0.859  0.693     5.14     4.15 strong     -0.986          -0.165
#>  7 100316005 chr33:7471139_A/C AGL55  0.695  0.861     3.97     4.91 strong      0.939           0.165
#>  8 100316005 chr33:7472830_A/T ALX3   0.972  0.776     4.23     3.43 strong     -0.806          -0.185
#>  9 100316005 chr33:7473857_T/C ALX3   0.919  0.773     4.02     3.42 weak       -0.600          -0.138
#> 10 100316005 chr33:7473583_G/A ARG80  0.731  0.961     3.16     4.15 strong      0.993           0.230
#> # ℹ 1,325 more rows
mball <- vignettedata$mball
mball
#> # A tibble: 12,689 × 10
#>    gene_id   SNP_id            tf        pctRef pctAlt scoreRef scoreAlt effect alleleDiff alleleEffectSize
#>    <chr>     <chr>             <chr>      <dbl>  <dbl>    <dbl>    <dbl> <chr>       <dbl>            <dbl>
#>  1 100315917 chr33:5706617_C/T ARG80      0.979  0.749     4.23     3.24 strong     -0.993           -0.230
#>  2 100315917 chr33:5706617_C/T ARG81      0.991  0.825     5.89     4.90 strong     -0.982           -0.165
#>  3 100315917 chr33:5703167_G/T ARGFX      0.781  0.889     5.06     5.74 weak        0.677            0.105
#>  4 100315917 chr33:5706617_C/T ARR1       0.634  0.880     2.53     3.42 strong      0.892            0.231
#>  5 100315917 chr33:5707492_C/T AT1G19040  0.882  0.779     7.60     6.73 strong     -0.861           -0.100
#>  6 100315917 chr33:5704406_C/G AT3G46070  0.784  0.892     5.13     5.79 weak        0.666            0.103
#>  7 100315917 chr33:5706617_C/T ATHB-12    0.781  0.890     4.12     4.67 weak        0.552            0.106
#>  8 100315917 chr33:5706617_C/T ATHB-13    0.721  0.868     4.98     5.98 strong      0.993            0.145
#>  9 100315917 chr33:5706617_C/T ATHB-16    0.813  0.966     5.32     6.32 strong      0.998            0.153
#> 10 100315917 chr33:5706617_C/T ATHB-4     0.778  0.931     4.98     5.94 strong      0.963            0.151
#> # ℹ 12,679 more rows
Summarize motifbreakR results on our 5 genes of interest. This shows us the actual values for the number of SNPs in the upstream regions of these genes, and summary statistics on the allele differences, effect sizes, etc. See the vignette and ?mb_summarize for details.
mbsmry <- mb_summarize(mbres)
mbsmry
#> # A tibble: 1 × 7
#>   ngenes nsnps nstrong alleleDiffAbsMean alleleDiffAbsSum alleleEffectSizeAbsMean alleleEffectSizeAbsSum
#>    <int> <int>   <int>             <dbl>            <dbl>                   <dbl>                  <dbl>
#> 1      5  1335     950             0.798            1066.                   0.155                   206.
Bootstrap resample motifbreakR results for all genes. Resample sets of 5 genes 250 times.
set.seed(42)
mbboot <- mb_bootstrap(mball, ngenes=5, boots = 250)
mbboot$bootwide
#> # A tibble: 250 × 9
#>     boot genes                                    ngenes nsnps nstrong alleleDiffAbsMean alleleDiffAbsSum alleleEffectSizeAbsMean alleleEffectSizeAbsSum
#>    <int> <chr>                                     <int> <int>   <int>             <dbl>            <dbl>                   <dbl>                  <dbl>
#>  1     1 431304;426469;100315917;396544;374124         5  1062     750             0.797             847.                   0.155                   164.
#>  2     2 426183;395959;431304;429501;396170            5  1244     914             0.808            1005.                   0.157                   195.
#>  3     3 102465361;426183;396544;426469;429172         5   886     655             0.812             720.                   0.149                   132.
#>  4     4 396007;407779;693245;429501;100498692         5  1514    1139             0.815            1234.                   0.153                   232.
#>  5     5 426883;396544;408041;426183;426469            5   925     623             0.787             728.                   0.147                   136.
#>  6     6 425059;429035;100529062;396007;425613         5  1350    1026             0.821            1109.                   0.155                   209.
#>  7     7 408042;426880;100498692;425499;426885         5   823     627             0.823             677.                   0.157                   129.
#>  8     8 396170;425058;426886;395587;396045            5  1262     910             0.805            1016.                   0.147                   185.
#>  9     9 102466833;426183;100529061;396045;395959      5  1263     963             0.822            1038.                   0.153                   193.
#> 10    10 429035;408042;100529062;100529061;425613      5  1289     987             0.823            1061.                   0.154                   198.
#> # ℹ 240 more rows
mbboot$bootdist
#> # A tibble: 6 × 2
#>   metric                  bootdist
#>   <chr>                   <list>
#> 1 alleleDiffAbsMean       <dbl [250]>
#> 2 alleleDiffAbsSum        <dbl [250]>
#> 3 alleleEffectSizeAbsMean <dbl [250]>
#> 4 alleleEffectSizeAbsSum  <dbl [250]>
#> 5 nsnps                   <dbl [250]>
#> 6 nstrong                 <dbl [250]>
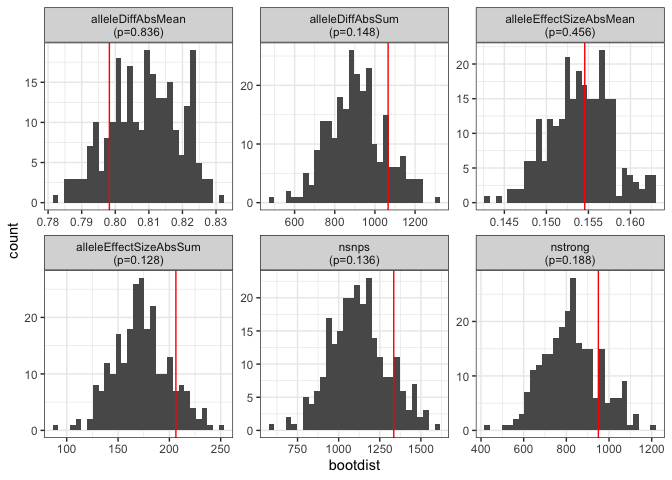
Compare the values from our five genes of interest to the empirical null distribution from bootstrap resampling.
bootstats <- mb_bootstats(mbsmry, mbboot)
bootstats
#> # A tibble: 6 × 5
#>   metric                      stat bootdist     bootmax     p
#>   <chr>                      <dbl> <list>         <dbl> <dbl>
#> 1 nsnps                   1335     <dbl [250]> 1597     0.136
#> 2 nstrong                  950     <dbl [250]> 1210     0.188
#> 3 alleleDiffAbsMean          0.798 <dbl [250]>    0.831 0.836
#> 4 alleleDiffAbsSum        1066.    <dbl [250]> 1304.    0.148
#> 5 alleleEffectSizeAbsMean    0.155 <dbl [250]>    0.163 0.456
#> 6 alleleEffectSizeAbsSum   206.    <dbl [250]>  251.    0.128
Visualize the results:
plot_bootstats(bootstats)
See vignette("intro", package="tfboot") or the articles on the pkgdown documentation website for more.
